Preamble,
This paper turns a simple idea into a plan. You visited Soho House, Soho House |Members’ Clubs you saw what works, and you want to build a stronger competitor. The pages that follow benchmark the category, outline a differentiated concept, and set clear financial and operating guardrails to move from idea to investable venture. The analysis and the Atelier Club blueprint was drafted to anchor this work.
Analysis: Soho House Market Analysis below and Competitor framework (appendices) and outline proposal: The Atelier Club , Atelier Micro : Atelier Micro
Analysis: Soho House Market Analysis: Investment & Strategic Assessment
Executive Summary
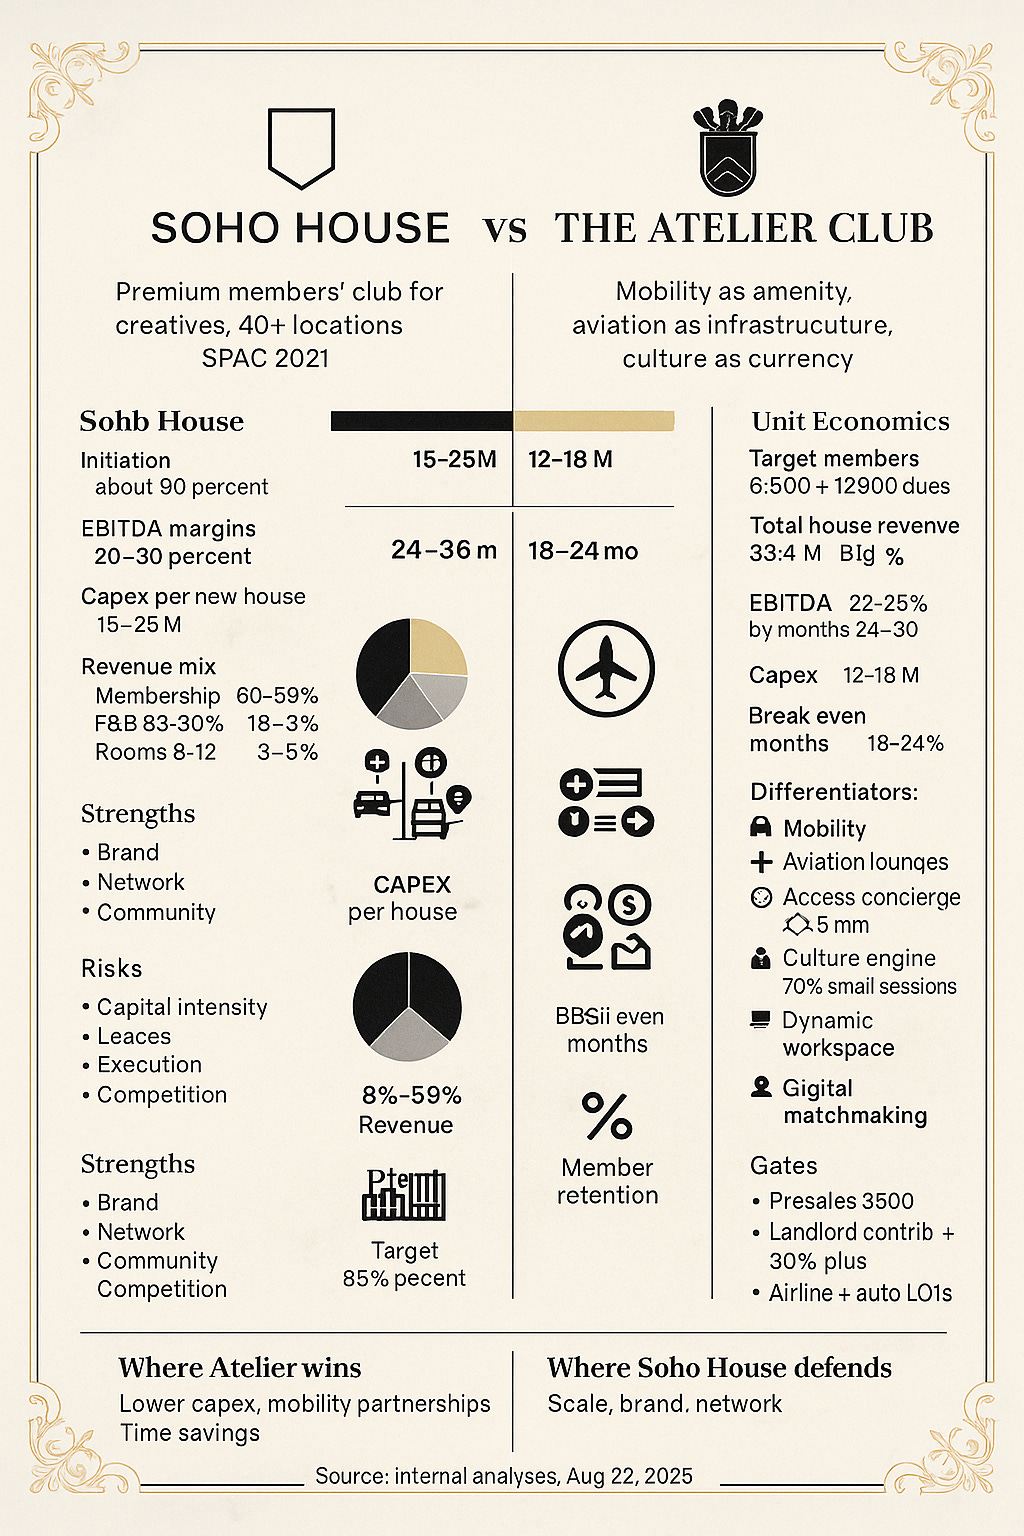
Soho House operates a premium members’ club concept targeting creative professionals, with 40+ global locations and a market capitalization of approximately $400M (as of recent trading). The company went public via SPAC merger in 2021, providing transparency into a traditionally opaque luxury hospitality sector.
Market Position Analysis
Core Business Model
- Revenue Streams: Membership fees (recurring), food & beverage, accommodation, events
- Target Demographics: Creative professionals, media executives, entrepreneurs (ages 25-45)
- Geographic Footprint: Major global cities with creative economies (London, NYC, LA, Berlin, Mumbai)
- Pricing Strategy: Premium positioning with initiation fees ($1,800-$3,200) and annual dues ($2,400-$4,800)
Financial Performance Metrics
- Revenue Growth: Strong pre-pandemic trajectory, recovery post-2022
- Member Retention: High retention rates (~90%+) indicating strong value proposition
- Unit Economics: Mature houses show strong EBITDA margins (20-30%)
- Expansion Costs: High upfront capital requirements ($15-25M per new house)
Competitive Landscape Analysis
Direct Competitors
1. Traditional Private Clubs
- Examples: The Yale Club, Union Club, Country clubs
- Advantages: Established prestige, lower operational costs, property ownership
- Disadvantages: Aging membership, limited geographic reach, outdated amenities
2. Co-working/Social Clubs
- Examples: WeWork, The Wing, NeueHouse
- Advantages: Lower membership fees, flexible terms, tech-forward approach
- Disadvantages: Less exclusive, limited F&B offerings, weaker community bonds
3. Luxury Hotels/Hospitality
- Examples: Edition Hotels, 1 Hotels, boutique properties
- Advantages: No membership barriers, broader market appeal
- Disadvantages: Less community aspect, higher per-visit costs
Competitive Advantages
- First-mover advantage in creative professional segment
- Global network effect – membership works across all locations
- Curated community creates significant switching costs
- Integrated hospitality offering (clubs + hotels + restaurants)
- Strong brand recognition in target demographic
Market Opportunities
1. Geographic Expansion
Untapped Markets:
- Asia-Pacific: Tokyo, Sydney, Singapore expansion opportunities
- Secondary US Cities: Austin, Nashville, Portland – growing creative hubs
- Emerging Markets: Mexico City, São Paulo, Cape Town
Revenue Potential: Each new market represents $20-40M annual revenue opportunity
2. Demographic Expansion
Adjacent Segments:
- Tech Entrepreneurs: Overlapping but distinct from traditional creatives
- Luxury Travelers: Premium nomadic professionals
- Corporate Partnerships: Company memberships for creative agencies
3. Digital/Virtual Offerings
Opportunities:
- Virtual events platform for global member engagement
- Digital content creation and member-generated content
- E-commerce platform for Soho House branded products
- Soho House streaming service leveraging screening room content
4. Ancillary Revenue Streams
New Concepts:
- Soho House Residences: Long-term luxury housing for members
- Soho House Wellness: Spa and fitness concept expansion
- Soho House Workspace: Day-use co-working for non-members
- Event Hosting Services: Corporate retreats and private events
Novel Applications & Innovation Opportunities
1. Hybrid Membership Models
- Tiered Access: Different membership levels with varying privileges
- Flexible Memberships: Seasonal or project-based memberships for freelancers
- Corporate Packages: Team memberships for creative agencies
2. Technology Integration
- AI-Powered Matching: Connect members with similar interests/projects
- Augmented Reality: Virtual house tours and remote participation
- Blockchain/NFT Integration: Digital membership tokens and exclusive content
3. Sustainable Luxury
- Carbon-Neutral Operations: Appeal to environmentally conscious creatives
- Local Sourcing: Community-focused F&B and art curation
- Circular Economy: Furniture rental and sustainable design practices
Profitability Analysis
Revenue Drivers
- Membership Fees: 60-65% of revenue, highly predictable
- Food & Beverage: 25-30% of revenue, higher margins
- Accommodation: 8-12% of revenue, premium pricing
- Events & Other: 3-5% of revenue, high-margin services
Cost Structure
- Real Estate: 30-35% of revenue (rent/property costs)
- Labor: 25-30% of revenue (service-intensive model)
- F&B Costs: 8-12% of revenue
- Marketing/Member Acquisition: 3-5% of revenue
Path to Profitability
Mature Houses: 20-30% EBITDA margins after 2-3 years of operation New Openings: Break-even typically achieved in year 2-3 Scale Benefits: Corporate overhead leverage improves with expansion
Investment Thesis
Bull Case Arguments
- Recession-Resilient Model: High-income creative professionals maintain memberships
- Global Network Effects: Each new location increases value for existing members
- High Switching Costs: Strong community bonds create member loyalty
- Expanding Creative Economy: Growing target demographic globally
- Multiple Expansion Opportunities: Geographic, demographic, and service expansion
Bear Case Considerations
- Economic Sensitivity: Luxury spending vulnerable in downturns
- High Capital Requirements: Significant upfront investment for expansion
- Execution Risk: Maintaining culture and quality across global expansion
- Competition: WeWork and co-working spaces targeting similar demographics
- Real Estate Risk: Long-term lease commitments in premium locations
Strategic Recommendations
For Soho House Management
- Accelerate Asia-Pacific Expansion: Capitalize on growing creative economies
- Develop Digital Platform: Create virtual community engagement tools
- Introduce Flexible Memberships: Capture gig economy professionals
- Expand Ancillary Services: Wellness, co-working, and residential offerings
For Investors
- Long-term Growth Play: Strong fundamentals but requires patient capital
- Monitor Unit Economics: Focus on mature house performance metrics
- Real Estate Strategy: Evaluate lease vs. ownership decisions
- Competitive Positioning: Track market share in key creative hubs
Market Valuation Framework
Key Valuation Metrics
- EV/Revenue Multiple: 2-3x revenue (comparable to premium hospitality)
- EV/EBITDA Multiple: 15-20x (reflecting growth premium)
- Price per Member: $8,000-$12,000 per member globally
Fair Value Range
Based on discounted cash flow analysis and comparable company multiples: Base Case: $600-800M enterprise value Bull Case: $1.0-1.2B (successful global expansion) Bear Case: $300-400M (limited growth, competitive pressure)
Conclusion
Soho House represents a unique investment opportunity in the luxury hospitality sector, with a differentiated business model targeting an underserved but affluent demographic. The company’s global expansion potential, strong unit economics at mature locations, and significant barriers to entry create a compelling long-term investment thesis, albeit with meaningful execution risks and capital requirements.
Appendices : Competitor : Venture Blueprint: A New Competitor to Soho House
1) Concept and Positioning
- Name placeholder: Atelier Club. see
- Core idea: A travel‑grade, partnership‑driven members club that blends hospitality, workspace, culture, and mobility. You get a curated network of houses, transit perks, and premium brand access in one membership.
- Target member: 27 to 50, creative leaders, founders, investors, culture shapers. Global, high intent travelers.
- Promise: Save members time, expand access, and increase serendipity. Deliver best‑in‑city spaces, movement, and moments.
2) Differentiators and Novel Services
- Mobility as an amenity
- Premium auto partners for on‑demand test drives, airport transfers, and weekend escapes.
- EV fast charging in‑garage. Valet and detailing credits.
- Micro‑pavilions in clubs where partners rotate new models with interactive brand labs.
- Aviation stack
- Airline status matches, mileage boosts, priority waitlist, and irregular‑ops recovery line.
- Co‑curated airport suites in key hubs with day‑use work pods and showers.
- Seasonal member fly‑ins that anchor club pop‑ups and residencies.
- Concierge for access
- Citywide access layer that books private galleries, studios, rehearsal spaces, chef tables, and hidden venues.
- 24 by 7 messaging. Guaranteed doors‑open inventory across a partner grid.
- Curated culture engine
- Weekly small‑format sessions. Craft, critique, and collaboration labs.
- Patron tier funds emerging artists, chefs, and makers in residence.
- Workspace that breathes
- Quiet carriages by day, salon energy by night. Booking controls that turn over space with intent.
- Project rooms with gear closets, podcast suites, mini edit bays, maker corners.
- Digital layer
- Interest graph that matches people to people, projects, and perks.
- Member‑only marketplace for commissions, pop‑ups, and collabs.
3) Product and Amenities
- Houses: 35 to 60 thousand square feet. Restaurant, library, studio, wellness, roof or garden, 30 to 60 keys of rooms when viable.
- Wellness: Heat and cold therapy, PT and recovery lab, sunrise and nightcap classes.
- F&B: Two outlets per site. One all‑day, one chef‑led concept with seasonal residencies.
- Events: 12 to 18 touchpoints per week per house. 50 percent member‑generated.
- Family and youth windows: Select weekend blocks. Clear noise and flow rules.
4) Membership and Pricing
- Tiers:
- Core, access to one city cluster.
- Global, all houses and travel perks.
- Patron, culture fund, concierge priority, private dining inventory.
- Add‑ons: Partner garage plan. Airline elite accelerator. Room credits pack.
- Controls: Invite and referral gating. Trial via hosted salons.
5) Partnerships and Synergies
- Premium auto
- Co‑branded urban mobility credits. Member test days. Track and off‑road experiences.
- Performance labs, design talks, and heritage showcases.
- Airlines
- Fare class upgrades, route launches with member previews, and content partnerships.
- Joint airport suites and disruption support line.
- Hospitality and venues
- Overflow room blocks with boutique hotels. Private venue share for concerts and screenings.
- Creators and institutions
- Museum after‑hours, university labs, and studio residencies.
6) Site Selection Strategy
- City tiers and entry logic
- Tier A global hubs with high creative GDP and strong air connectivity.
- Tier B rising hubs with favorable rents and fast talent growth.
- Resort satellites that fill seasonal calendars and sponsor patron trips.
- Micro‑location filters
- Ten minute walk to art, media, and design clusters.
- Existing or convertible parking for the mobility program.
- Ceiling height, roof or courtyard potential, acoustic control, venting for two kitchens.
- Mixed use zoning, later trading hours, licensing path inside 6 months when possible.
- Launch path suggestion
- Wave 1: London East, Austin South Central, Singapore Downtown Core.
- Wave 2: Mexico City Roma Norte, Dubai Design District, Berlin Kreuzberg.
7) Unit Economics and Model Guardrails
- CapEx per house target: 12 to 18 million through landlord contributions, asset‑light interiors, modular fit‑out.
- Revenue mix at scale: 55 to 60 percent membership, 20 to 25 percent F&B, 10 to 15 percent experiences and events, 5 to 10 percent partnerships and brand activations.
- Membership base per house: 5,000 to 8,000 paying members depending on size and city.
- EBITDA target: 22 to 28 percent in months 24 to 30 post‑opening.
- Break‑even: Months 18 to 24 with staged ramp of floors and outlets.
- Cash discipline: Pre‑sold founder lots. Partner funded showrooms. Dynamic opening calendar to load demand.
8) Weaknesses to Exploit in Incumbent Models
- High upfront capital and heavy lease liabilities.
- Limited mobility and aviation integration.
- Digital community underused versus physical footprint.
- Event calendars skew to social, less to making and collaboration.
- Brand dilution risk when scaling quickly.
Countermoves
- Asset‑light real estate and revenue share with landlords.
- Partner‑financed mobility and aviation layers that also acquire members.
- A strong digital matchmaker that converts to real projects and commissions.
- Member‑generated programming tracked to outcomes, not only attendance.
9) Stakeholder Map and Analysis
- Members: Seek access, time savings, status, and output. Segment by creator type and travel intensity.
- Investors: Seek moderate risk with steady cash yields, and brand equity growth.
- Landlords and cities: Seek activation, footfall, and safe night‑time economy.
- Premium auto and airlines: Seek qualified demand, data, and halo effects.
- Staff and creators in residence: Seek careers, credits, and audiences.
- Neighbors and regulators: Seek noise and traffic control, and community access windows.
Engagement plans
- Member councils per house. Quarterly investor open books.
- Local hiring and creator residencies tied to neighborhoods.
- Mobility and noise covenants, with annual reports.
10) Operating Model
- General Manager triad: Hospitality lead, culture lead, partnerships lead.
- Concierge desk: Hybrid human plus software. Citywide inventory pipes. SLA backed.
- Programming studio: 3 to 5 curators per region. 70 percent small rooms, 30 percent headline moments.
- Data and CRM: Interest graph, partner tags, and project boards. Privacy by design.
- Safety and compliance: Clear guest rules, digital incident logging, quarterly drills.
11) Financial Plan Snapshot
- Per house steady state
- Members: 6,500 at blended 2,900 annual dues.
- Membership revenue: 18.9 million.
- F&B revenue: 8.0 million.
- Experiences and events: 4.0 million.
- Partnerships and activations: 2.5 million.
- Total: 33.4 million.
- EBITDA at 25 percent: 8.4 million.
- Corporate layer
- Lean HQ, regional pods. Overhead below 8 percent of revenue at 6 houses.
12) Go‑to‑Market and Rollout
- Phase 0: Shadow community building, pop‑ups, and supper clubs.
- Phase 1: First house, full partner stack in one city. Target 4,000 pre‑sold members.
- Phase 2: Two houses in complementary time zones. Airport suite pilot.
- Phase 3: Six houses and three airport suites. Introduce Patron trips.
13) KPIs
- Paid members, ARPU, and retention.
- Utilization by room type and daypart.
- Event yield and member‑generated share.
- Partner activation revenue and NPS.
- Time to wait for concierge access.
- Staff engagement and creator placements.
14) Risk and Mitigation
- Macro slowdown: Pre‑sold tiers, flexible dues, and partner offsets.
- Culture dilution: Member councils, curator tenure, and acceptance rate guardrails.
- Lease risk: Break clauses, variable rent, and ownership options case by case.
- Safety and nuisance: Acoustic build, traffic plans, and family windows.
- Partner conflicts: Category exclusivity with performance gates.
15) Next Steps
- Build partner pipeline brief for two premium auto brands and one airline alliance.
- Run a pop‑up month to validate demand, capture 1,000 deposits, and prove concierge SLAs.
- Lock first site term sheet with landlord contribution and revenue share.
- Stand up data and CRM with consented profiles and project boards.


