
Preamble
AI in 2026 is no longer just a model race. This longform report explains the AI industry’s current status, PESTLE drivers, People/Process/Technology/Data implications, probabilistic scenarios, black-swan risks and strategic responses through 2031.
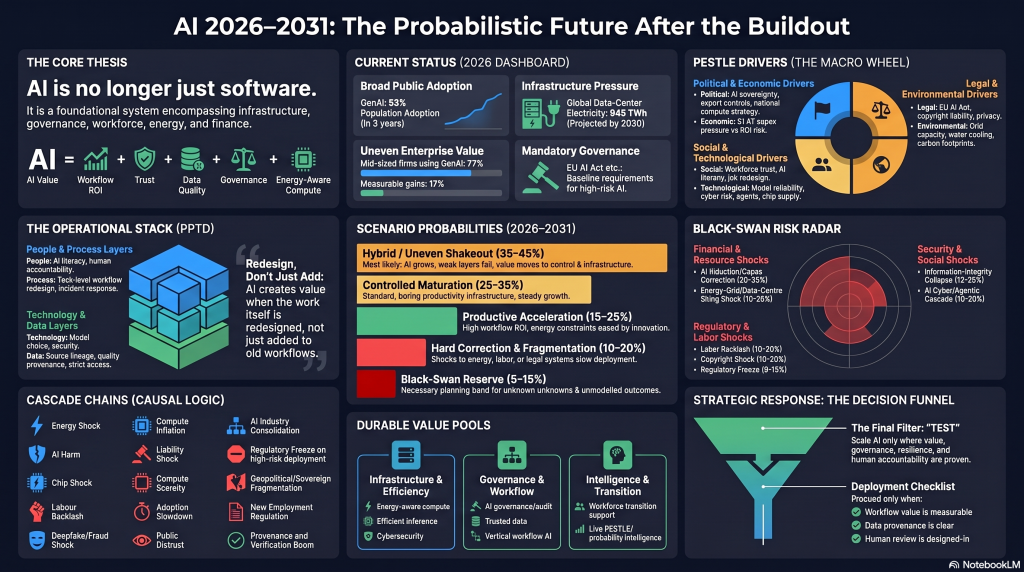
Introduction: AI is becoming an infrastructure industry
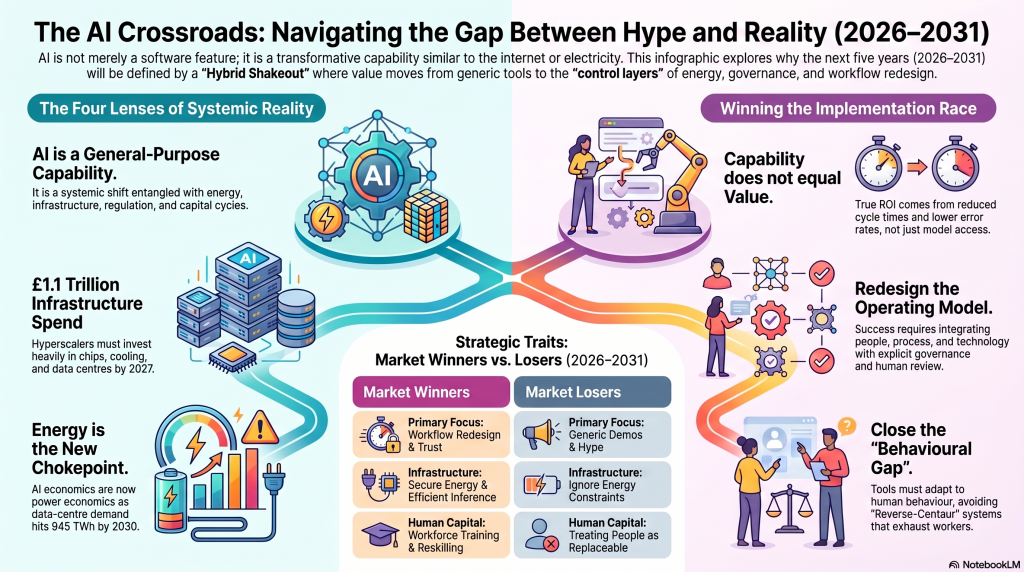
AI’s next phase will be decided less by who has the flashiest model and more by who can combine energy, compute, trusted data, governance, workforce redesign and measurable economics.
The current state can be summarised in one line: broad adoption, uneven value, rising infrastructure pressure.
The web version of this article is designed as a strategic reference. It includes tables, diagrams and decision tools that can be reused in board papers, strategy workshops, investor notes or risk briefings. References: Reports
1. 2026 status dashboard
| Dimension | Status now | Direction | Strategic implication |
| Adoption | Fast public adoption; uneven enterprise depth | Rising | Usage is real, but workflow redesign determines value. |
| Value capture | Strong anecdotes; mixed measurable ROI | Mixed | Buyers are shifting from demos to evidence. |
| Infrastructure | Data centres, chips and energy becoming constraints | Tightening | Compute and power are strategic inputs. |
| Governance | Regulation and risk management formalising | Tightening | Compliance becomes a product feature. |
| Labour | Skills and job redesign lag adoption | Volatile | People strategy is now an AI strategy issue. |
| Competition | Platform concentration grows; vertical niches remain open | Consolidating | Moats shift to data, distribution, governance and workflow integration. |
2. The AI value chain
The AI industry is best understood as a layered system. Physical constraints at the bottom shape economics at the top.
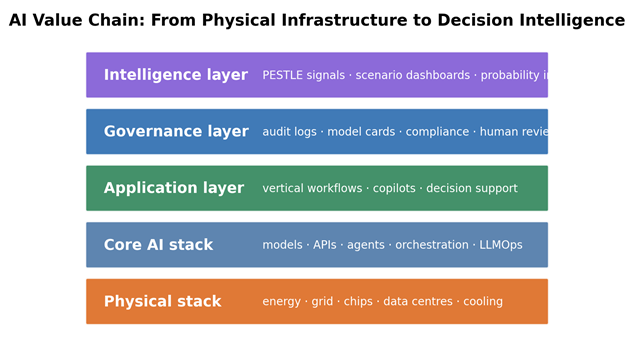
Diagram 1. AI value chain from physical infrastructure to decision intelligence.
| Layer | Included segments | Strategic role |
| Physical stack | Power, grid, water, cooling, chips, networking, data centres | Controls physical scalability. |
| Core AI stack | Foundation models, APIs, agents, orchestration, LLMOps/MLOps | Controls technical capability and unit economics. |
| Application layer | Enterprise copilots, workflow automation, vertical AI, analytics | Converts capability into business value. |
| Governance layer | Audit logs, model cards, risk registers, human review, provenance | Converts risky AI into deployable AI. |
| Intelligence layer | PESTLE signals, prediction-market sentiment, scenario dashboards | Converts uncertainty into monitored decision support. |
3. PESTLE drivers shaping AI through 2031
| PESTLE driver | Current signal | Enterprise implication | Non-enterprise implication |
| Political | AI sovereignty, export controls, national compute strategies | Supplier diversification and country-risk monitoring | Unequal access by country; public-sector AI opportunities |
| Economic | High investment, uncertain ROI, infrastructure capex | Cost-per-task, cost-per-compute and value-per-energy discipline | Low entry barriers but higher competition and subscription dependence |
| Social | Worker trust, job redesign, AI literacy and legitimacy | Training, communication, labour relations and responsible adoption | New micro-businesses, but income volatility and commoditisation |
| Technological | Model reliability, agents, cybersecurity and stack dependency | LLMOps, security, monitoring and vendor fallback | Powerful SaaS access but limited stack control |
| Legal | EU AI Act, copyright, liability, privacy, employment law | AI governance boards, audit trails and legal reserves | Confidentiality, copyright and disclosure exposure |
| Environmental | Data-centre power, water, cooling, grid and carbon pressure | Power strategy and sustainability reporting | Costs hidden inside subscriptions; local backlash visible |
4. People, Process, Technology and Data: the operating model
AI succeeds when the operating model changes with the tool. Organisations that only buy software often get pilot fatigue, shadow AI and weak ROI.
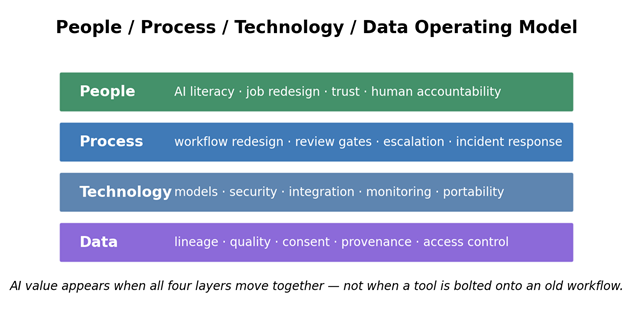
Diagram 2. The People / Process / Technology / Data operating model.
| PPTD layer | Main implication | Failure mode | What to build |
| People | AI literacy, role redesign, human accountability | Workers resist, misuse or secretly route around official systems | Role-based training, worker voice, review authority |
| Process | Task decomposition, review gates, escalation, incident response | AI accelerates broken workflows | Human-in-loop process maps, audit logs, escalation playbooks |
| Technology | Model choice, security, integration, monitoring, fallback | Vendor lock-in, prompt injection, tool abuse | Modular stack, LLMOps, red-team testing, vendor alternatives |
| Data | Lineage, quality, consent, provenance and access control | Bad data produces plausible but wrong outputs | Trusted knowledge infrastructure and source tracing |
5. Scenario probabilities: 2026–2031
The most useful future model is probabilistic. These are planning bands, not predictions.
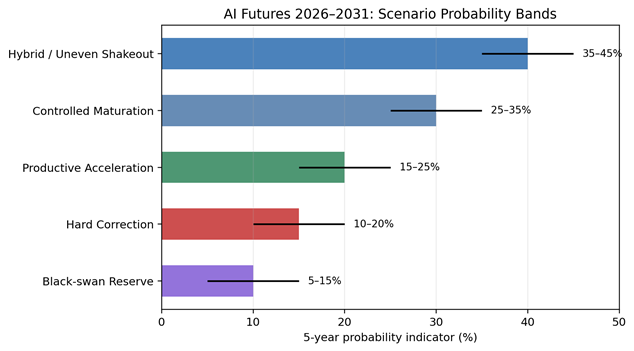
Diagram 3. Scenario probability bands for the AI industry through 2031.
| Scenario | Probability indicator | Description | Likely winners |
| Hybrid / uneven shakeout | 35–45% | AI grows while weak layers fail and value shifts to control layers | Energy-aware compute, governance, security, vertical AI |
| Controlled maturation | 25–35% | AI becomes ordinary productivity infrastructure with stronger compliance | Enterprises with data maturity and operating discipline |
| Productive acceleration | 15–25% | Workflow ROI improves, efficient compute scales, trust rises | Vertical AI, AI-for-energy, industrial AI, training |
| Hard correction | 10–20% | Energy, valuation, legal, cyber or labour shocks slow deployment | Cash-disciplined firms, infrastructure owners, assurance providers |
| Black-swan reserve | 5–15% | Structurally unmodelled shocks outside normal probability bands | Resilient organisations with options and monitoring |
6. Black-swan risk register
Black swans are best understood as cascade risks. The danger is not only the trigger; it is how the trigger transmits across PESTLE dimensions.
| Rank | Scenario | Probability band | Impact if triggered | Dominant gap | Strategic stance |
| 1 | Energy-grid and data-centre siting shock | 15–25% | Very high | Dependency / Economic | Hedge power and compute exposure |
| 2 | AI cyber / agentic cascade | 10–20% | Very high | Capability / Dependency | Constrain agent permissions and monitor incidents |
| 3 | Regulatory-liability freeze after major harm | 8–15% | High–very high | Regulatory / Behavioral | Pre-build auditability and human review |
| 4 | Chip / geopolitical rupture | 8–15% | Very high | Dependency / Political | Diversify stack and use model efficiency |
| 5 | AI valuation and capex correction | 20–35% | High | Economic | Prioritise value-per-workflow and cash discipline |
| 6 | Information-integrity collapse | 12–25% | High | Behavioral / Legal | Invest in provenance and verification |
| 7 | Copyright / data provenance shock | 10–20% | High | Legal / Capability | Use licensed data and source lineage |
| 8 | Labour backlash and adoption revolt | 10–20% | Medium–high | Behavioral / Economic | Redesign work with worker voice |
7. Cascade diagrams: how shocks travel
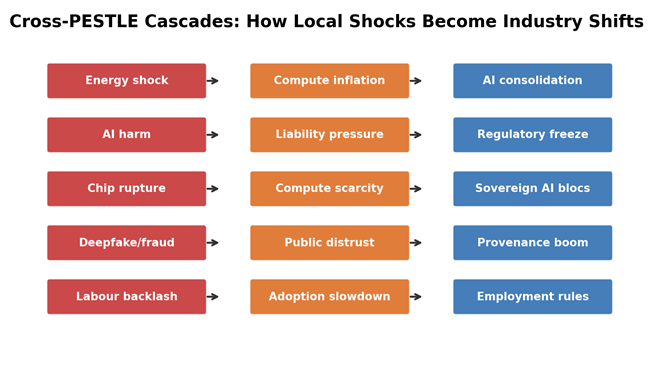
Diagram 4. Cross-PESTLE cascade chains.
| Cascade | Local or global? | Impact on AI industry | Ancillary value created |
| Energy shock → compute inflation → AI consolidation | Local trigger, global pricing effect | Raises inference cost and delays data-centre buildout | Power strategy, workload routing, efficient models |
| AI harm → liability → regulatory freeze | Local incident, global regulatory copycat risk | Slows high-risk AI procurement | Audit, assurance, insurance, human review |
| Chip rupture → compute scarcity → sovereign AI blocs | Global | Fragments supply chains and model deployment | Domestic chips, model efficiency, sovereign cloud |
| Deepfake/fraud shock → public distrust → provenance boom | Global | Weakens trust in digital evidence | Verification, watermarking, identity, source tracing |
| Labour backlash → adoption slowdown → employment rules | Local-to-global | Slows automation framed as replacement or surveillance | Workforce transition and augmentation-first design |
8. Regional strategy: U.S., Europe and China
| Region | AI implementation style | Main strength | Main vulnerability | Best strategic position |
| United States | Scale first, optimise later | Frontier platforms, hyperscalers, venture capital, enterprise software | Energy bottlenecks, capex pressure, platform concentration | Lead frontier AI and cloud platforms, but improve energy discipline |
| Europe | Regulate, measure, then scale | Trust, industrial systems, AI Act compliance, energy efficiency | Slow scale and dependence on U.S. platforms | Win trusted, regulated, energy-aware AI deployment |
| China | Coordinate infrastructure as national strategy | State coordination, manufacturing, applied AI, infrastructure planning | Chip controls, geopolitical trust limits, green-power integration | Lead coordinated applied AI and industrial automation |
9. Enterprise and non-enterprise implications
| Dimension | Enterprise implication | Non-enterprise implication | Finance implication |
| People | Role redesign, AI governance jobs, training burden, labour relations | AI literacy, micro-businesses, income pressure | Training, redeployment, workforce transition costs |
| Process | Workflow redesign, review gates, audit trails, procurement controls | Faster work with quality and disclosure risk | Integration and QA costs |
| Technology | Cloud, model, data, security and vendor dependency | SaaS dependence and subscription creep | Compute/API costs and switching costs |
| PESTLE | Regulation, geopolitics, energy, labour and liability | Access inequality and platform dependency | Risk reserves, compliance costs, insurance premiums |
| Finance | ROI discipline, capex/opex shift, value per workflow | Lower start-up cost but margin compression | Cash discipline and measurable value required |
10. Comparison with other AI solution approaches
| Approach | Strength | Weakness | Best use |
| Model-first AI | Fast capability and broad feature velocity | Weak defensibility if not tied to workflow | Research, prototyping, platform leverage |
| Tool-first enterprise AI | Low friction and easy deployment | Pilot fatigue and weak governance | Personal productivity and early discovery |
| Governance-first AI | Trust, compliance, regulated-sector adoption | Slower deployment and higher cost | Healthcare, finance, insurance, public sector |
| Probability/PESTLE intelligence | Detects scenario drift and external cascades | Can overstate signal if calibration is weak | Strategy, risk, geopolitical monitoring |
| Hybrid operating model | Combines workflow ROI, governance and monitoring | Requires cross-functional leadership | Best default strategy for serious deployment |
11. 90-day test plan
| Period | Task | Output | Kill / scale signal |
| Days 1–15 | Map one sector and 20 workflows; interview 10 users | Workflow opportunity map | Kill if pain is vague or infrequent |
| Days 16–30 | Build three scenarios and identify cross-scenario pain | Scenario-filtered value case | Kill if value depends on one fragile future |
| Days 31–60 | Prototype one measurable job with human review | Pilot-ready workflow | Scale if users return after novelty |
| Days 61–90 | Run paid pilot with 3–5 customers | Measured ROI, risk and adoption report | Scale only if users pay and change workflow |
12. FAQ
Is AI a bubble?
Parts of AI may be a bubble, especially generic products without durable workflow value. But history suggests useful infrastructure can survive even when speculative layers fail.
What is the most likely future?
A hybrid uneven shakeout: AI continues to grow, but value shifts from generic tools to energy-aware compute, trusted data, vertical AI, governance, security and workforce redesign.
What should enterprises do first?
Pick one high-friction workflow, add governance from the start, measure value and test adoption before scaling.
What is the biggest risk?
Energy and infrastructure constraints are the most visible global chokepoint. Cyber, liability, data provenance, labour backlash and valuation correction are major cascade risks.
Where is the best business opportunity?
Trust-heavy, measurable, workflow-specific AI: compliance, audit, verification, vertical copilots, AI energy optimisation, training and PESTLE probability intelligence.
Conclusion: AI’s future is conditional
The next five years of AI will not be decided by model capability alone. They will be decided by energy, governance, workforce redesign, data quality, liability, trust and measurable economics.
The durable winners will treat AI as an operating-system transformation, not a software purchase.
The decision is Test. Scale only where repeated use, measurable value, governance readiness, energy awareness and human accountability are proven.
Appendices
The Non tabular report
The status of AI in 2026: broad adoption, uneven value, rising pressure
By 2026, AI has clearly crossed from novelty into mass attention. Stanford’s 2026 AI Index describes a rapid adoption curve and a major investment surge. The IEA’s energy work shows another side of the same story: data-centre electricity consumption could reach around 945 TWh by 2030. The EU AI Act is moving from policy text into operational reality, and U.S. Census business data shows that AI use is real but still far from universal across firms.
This gives us the first paradox: adoption is fast, but value capture is uneven. People use AI. Teams experiment with AI. Executives fund AI. But the distance between a useful assistant and a transformed enterprise is still large.
That distance is where the opportunity lives. References: Reports
The model is not the moat
Many AI builders still act as if access to a powerful model is defensibility. It is not. Model access is becoming a necessary input, not a durable moat.
The more defensible layers are harder and less glamorous: proprietary workflow data, domain-specific evaluation, trusted distribution, auditability, integration into existing systems, human-in-the-loop accountability and switching costs inside real operations.
This is why so many AI products look impressive in a demo and then struggle in the messy workflow. A demo asks whether the system can produce something plausible. A workflow asks whether the system can produce the right thing repeatedly, under constraints, with accountability, at a cost the buyer can justify.
Energy is becoming the new gravity
For years, software scaled as if marginal cost was almost weightless. AI is different. Training and inference depend on chips, data centres, cooling, power contracts, grid connections and increasingly local political permission.
When energy becomes the chokepoint, AI stops being only a software race and becomes an energy-infrastructure race. A company with guaranteed access to hundreds of megawatts of reliable power may be more strategically positioned than a company with a better slide deck.
This does not mean AI stops. It means AI becomes disciplined. Low-value novelty workloads become harder to justify. Efficient inference, small models, retrieval, batching, workload routing and energy-aware compute become strategic.
AI value is people, process, technology and data
Enterprises often make the same mistake with every new technology wave: they buy the tool and postpone the operating model. With AI, that mistake is expensive.
People must change: new roles, AI literacy, review responsibility, worker trust and learning pathways. Process must change: task decomposition, human review gates, escalation, audit logs and incident response. Technology must change: model choice, integration, monitoring, cybersecurity and fallback options. Data must change: lineage, consent, access control, provenance and quality.
The simple version is this: AI does not create value by being added to old workflows. It creates value when work is redesigned.
The human question cannot be outsourced
There is a darker design pattern in AI adoption: the reverse-centaur system. Instead of a human using a machine to become more capable, the human becomes a component inside a machine system — correcting outputs, absorbing exceptions, carrying emotional labour and taking blame when automation fails.
This is not inevitable. It is a design choice. AI can augment skilled workers, reduce drudgery and widen access to capability. But it can also become surveillance, deskilling, speed-up and hidden labour transfer.
That is why any serious AI strategy must ask: who gets the gains, who carries the burden, who has the right to override, and who is accountable when the system fails?
The future is probably hybrid
The most useful five-year outlook is not a single prediction. It is a set of probability-weighted futures. The attached foresight report frames four main paths: productive acceleration, controlled maturation, governed disruption, and hard correction. The most likely path is hybrid: AI keeps growing, but weak layers fail and durable value concentrates around control layers.
In the hybrid future, generic AI apps become cheap and crowded. Vertical workflow AI becomes more valuable. Governance becomes a product feature. Security becomes mandatory. Energy-aware compute becomes a business discipline. Workforce redesign becomes the difference between adoption and productivity.
This is the dot-com lesson in a new form: some companies fail, but the underlying infrastructure remains.
The black-swan mistake
Black swans are often discussed as dramatic single events. The better way to think about them is as cascades. An energy shock becomes compute inflation. Compute inflation becomes margin pressure. Margin pressure becomes startup consolidation. A legal ruling becomes data retraining cost. A cyber incident becomes insurance tightening. A labour backlash becomes political intervention.
The most important black-swan-class risks in the attached report are energy-grid and data-centre siting shock, AI cyber or agentic cascade, regulatory-liability freeze after major harm, chip or geopolitical rupture, valuation correction, information-integrity collapse, copyright or data-provenance shock, and labour backlash.
None of these has to end AI. But any of them can change who wins.
The opportunity after the dust settles
The strongest opportunities are not “AI for everything.” They are narrow, measurable, trust-heavy and workflow-specific. They include AI compliance documentation, workflow redesign, verification and QA, vertical copilots, AI energy optimisation, human-AI training, local-language services, governance dashboards and probability-intelligence tools.
The common pattern is simple: sell trust, integration and measurable ROI, not magic.
After the shakeout, the durable value pools are likely to be energy-aware compute, efficient inference, trusted data, vertical workflow AI, AI governance and audit, model assurance, cybersecurity, workforce transition and live PESTLE intelligence.
What I would test now
Start with a small, paid, measurable pilot. Pick one sector. Map twenty workflows. Interview ten users. Find one task where AI can save time, reduce error, increase revenue or reduce risk. Add human review and traceability from the start. Measure usage after the novelty fades.
Kill the idea if users like the demo but will not change workflow or pay.
Scale only where repeated use, measurable value, governance readiness and resilience are visible.
Conclusion: the decision is Test
The AI future is not simply positive or negative. It is conditional. If organisations treat AI as a tool, many will underperform. If they treat it as a people, process, technology, data, governance and infrastructure transformation, AI can become durable productivity infrastructure.
The decision is not blind acceleration or paralysis. The decision is Test.
Test before scaling. Test value per workflow. Test value per unit of compute. Test governance. Test resilience. Test whether humans are genuinely helped, not merely absorbed into the machine.
The five-year scenario map
The scenario probabilities below are planning bands, not predictions. They should be updated as signposts change.
| Scenario | Probability indicator | What it means |
| Hybrid / uneven shakeout | 35–45% | AI grows, weak layers fail, value concentrates in control layers. |
| Controlled maturation | 25–35% | AI becomes ordinary productivity infrastructure with stronger governance. |
| Productive acceleration | 15–25% | Workflow ROI, regulation and efficient compute unlock broad gains. |
| Hard correction | 10–20% | Energy, valuation, legal, cyber or labour shocks trigger consolidation. |
| Black-swan reserve | 5–15% | Unknown unknowns remain outside normal modelling. |
Sources and Further Reading
This article draws on the attached AI Status Report, Probabilistic Futures Report, Black Swan Scenario Report, four-lens AI analysis, and the reference sources below. Probability bands are scenario indicators for planning discipline, not forecasts.
1. Stanford HAI, 2026 AI Index Report: https://hai.stanford.edu/ai-index/2026-ai-index-report
2. International Energy Agency, Energy and AI: https://www.iea.org/reports/energy-and-ai/energy-demand-from-ai
3. European Commission, EU AI Act timeline: https://digital-strategy.ec.europa.eu/en/policies/regulatory-framework-ai
4. U.S. Census Bureau, AI Use at U.S. Businesses: https://www.census.gov/library/stories/2026/05/ai-use-businesses.html
5. NIST, AI Risk Management Framework 1.0: https://nvlpubs.nist.gov/nistpubs/ai/nist.ai.100-1.pdf6. McKinsey & Company, The State of AI: Global Survey 2025: https://www.mckinsey.com/capabilities/quantumblack/our-insights/the-state-of-ai


